You can make organic shapes in Processing using Bézier curves. This tutorial will show you how to make these shapes with the help of a vector software such as Adobe Illustrator or Inkscape. The images used in this tutorial were created using Adobe Illustrator CC 2015.3.

First, using the pen tool in Illustrator (or a similar program), draw your shape (if you are not sure how to use the pen tool, please refer to this tutorial by Rosie. Once you save it, save a copy as an SVG file as well. When you save the SVG file, a window should pop up that looks like this:
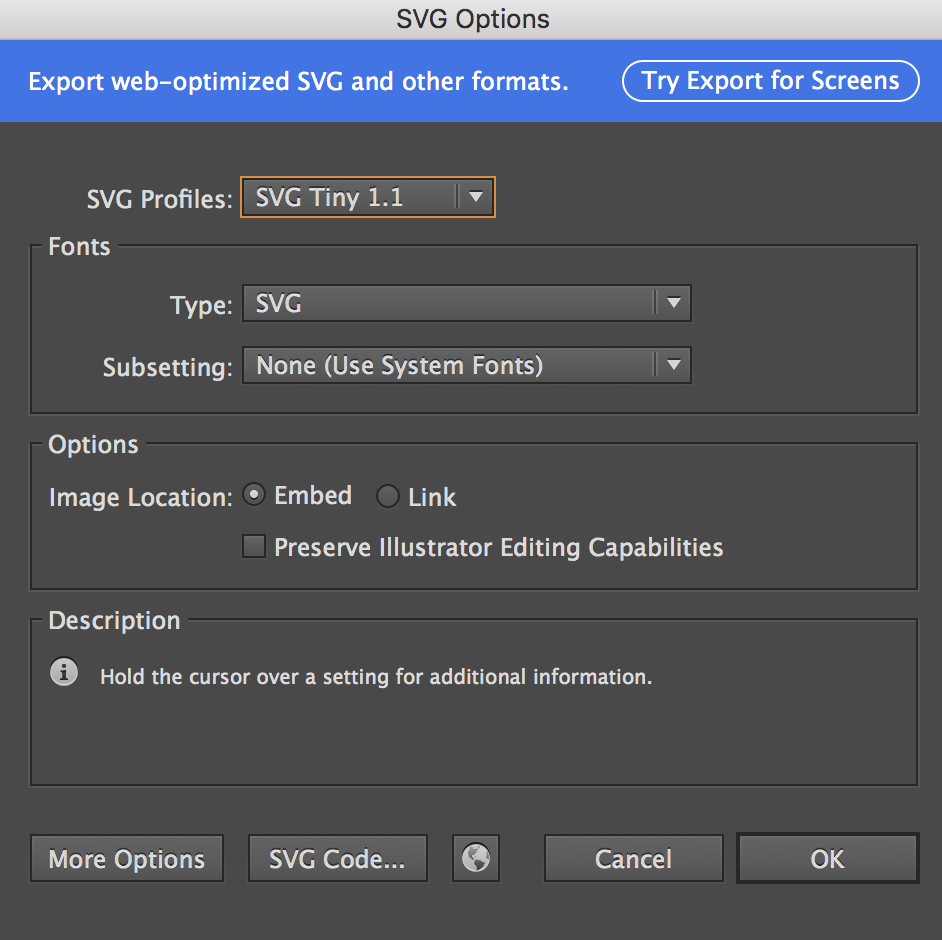
Select "SVG Code..." in the bottom left corner of this window, and a new text editor window will open, revealing the path for your curve! SVG files can be opened in any plain text editor such as TextEdit or Notepad to see this dat. I would suggest reading this helpful explanation of reading SVG path data if you want to know more about this, but you don't need to understand it for this tutorial, as I will be explaining the basics. If your shape is the only thing in the document (no images or other complex objects), your path will look something like this:
<?xml version="1.0" encoding="utf-8"?><!-- Generator: Adobe Illustrator 20.0.0, SVG Export Plug-In . SVG Version: 6.00 Build 0) --><svg version="1.1" baseProfile="tiny" id="Layer_1" xmlns="http://www.w3.org/2000/svg" xmlns:xlink="http://www.w3.org/1999/xlink"x="0px" y="0px" viewBox="0 0 600 600" xml:space="preserve"><path fill="#FFFFFF" stroke="#000000" stroke-miterlimit="10"d="M300,419.7c0,0,224.2, -246.7, 0,-290S197,338,300,262.4S242,498.2,300,419.7z"/></svg>
If you have more complexity to your SVG file than only this shape, I would recommend using Ctrl+F (or ⌘F on a Mac) to search for "path" in order to find the important information.
On lines 6 & 7, you see:
d="M300,419.7c0,0,224.2-246.7,0-290S197,338,300,262.4 S242,498.2,300,419.7z"
This tutorial is going to teach you how to read this data and translate it into a shape in Processing. As you can see, d is an attribute of the path element, and holds the data for the shape of the path. All this data can be a bit overwhelming, so we're going to break it up. Each letter in this string is the start of a new point, line, or curve. In your text editor, you can put each of these bits of information on its own line. When the line above is reformatted, we get this:
d="M300,419.7c0,0,224.2-246.7,0-290S197,338,300,262.4S242,498.2,300,419.7z"
If you've never created a Bézier curve with the pen tool before, watch this video to gain a better understanding of how they work.

In the diagram above, points designated by blue dots are called anchor points, and points in green are control points. The point names written in dark gray are points that I clicked to create myself, and the ones in light gray are reflections of those points over their anchor point. For the curve between P1 and P4, the control points are P2 and P5. The curve between P4 and P7 has control points P6 and P8. Since P6 is a reflection of P5, this curve would be drawn using the S (or s) command. Here's what the SVG path data would be for this line:
<!-- Please note that there most likely will not be commas between sets of coordinates. I have added them here so that the parentheses are not confused for multiplication.-->d ="M xP1, yP1c (xP2 - xP1), (yP2 - yP1), (xP3 - xP1), (yP3 - yP1), (xP4 - xP1), (yP4 - yP1)s (xP9 - xP4), (yP9 - yP4), (xP7 - xP4), (yP7 - yP4)"
Now that we have an idea of how to understand the SVG path, let's open a new window in Processing and start coding this shape. First, we set up our window and create a shape, using beginShape( ) and endShape( )
void setup() {size(600, 600);colorMode(HSB, 360, 100, 100, 100);background(0, 0, 100);strokeWeight(5);stroke(207, 54, 95);}void draw() {beginShape();//shape vertex//shape vertex//shape vertexendShape();}
To begin filling in our shape, we look at the first line of our SVG path:
d="M300,419.7This tells us that we need to put the first vertex at the absolute coordinates (300, 419.7).
beginShape();vertex(300, 419.7);endShape();
The next line of our SVG data path is the start of a curve, so we need to use a Bézier vertex.
c0,0,224.2-246.7,0-290
Since the c is not capitalized, these coordinates are relative. This means that every coordinate given by this curve must be added to the coordinates given by the last point before it (known as the current point; in this case, M) before being put into Processing.
beginShape();vertex(300, 419.7);bezierVertex(300, 419.7, 524.2, 173, 300, 129.7);endShape();
At this point, we should run our Processing program to see the first part of our shape. If it doesn't look quite how you expected, don't worry. You probably made an arithmetic mistake when adding coordinates. Fix it now. Did you miss a negative? Are all of your relative coordinates based off of the point before them? Run your program each time you add a new vertex or Bézier vertex to make these mistakes easier to find and correct.
The next curve uses the S command, and since it is capitalized, it uses absolute coordinates.
S197,338,300,262.4
Notice that the S command only gives us 2 sets of coordinates, but we need 3 sets to create a Bezier vertex. This is because with the S command, it is assumed that the first control point for the curve is a reflection of the last control point from the curve before it, over the current point (which is now the end anchor point of the previous curve). That's a lot to understand, so I'll walk you through it.
If we look at the previous curve, we see our current point is at (300, 129.7). Let's call this P1. The last control point for that curve was (524.2, 173), which we will call P0. We want to reflect P0 over P1 to find P2. This is just basic coordinate geometry.
So now that we have all of the coordinates, we can add the S command to our shape.
beginShape();vertex(300, 419.7);bezierVertex(300, 419.7, 524.2, 173, 300, 129.7);bezierVertex(75.8, 86.4, 197, 338, 300, 262.4);endShape();
Repeat these steps for the last S command, and our shape is finished!
beginShape();vertex(300, 419.7);bezierVertex(300, 419.7, 524.2, 173, 300, 129.7);bezierVertex(75.8, 86.4, 197, 338, 300, 262.4);bezierVertex(403, 186.8, 242, 498.2, 300, 419.7);endShape();